|
|
 Home
Home
 Search by miRNA:
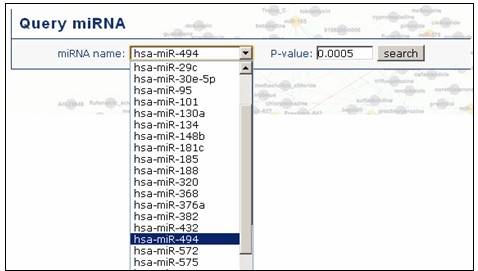
Step 1: Choose one of the queried miRNA from the drop-down menu. You can enter an appropriate threshold of p-value ranging from 0 to 1 as the significance level. The default value is 0.05. For example, to find the associated small molecules with hsa-miR-494, we firstly select hsa-miR-494 in the drop-down menu and click "search" button(Figure 1).
|
| Figure 1 Search the associations for hsa-miR-494 |
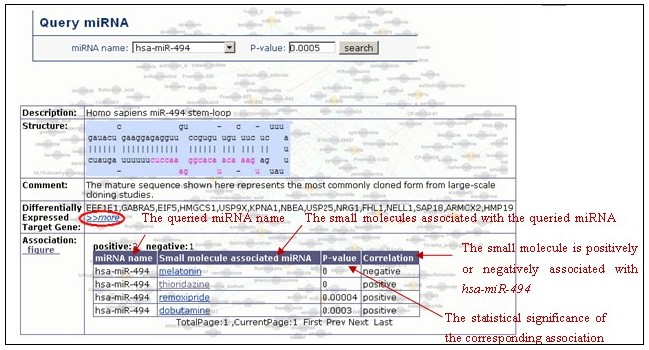
Step 2: The result page of the interested miRNA(Figure 2) contains the following 5 fields: Description - the interested miRNA name. Structure - secondary stem loop structure of the miRNA. Comment - information on the acquirement of the miRNA sequence. Differentially expressed target genes - Differentially expressed target genes obtained from meta-analysis. Association - A list of small molecules associated with the queried miRNA. The top-ranked set of small molecules is displayed in groups of twenty. The rows in the table are ordered in ascending order of p-value in default. Click each field name ("miRNA associated Small molecule", and "Correlation") to rank the entries in alphabetical order.
|
| Figure 2 The result page of the interested miRNA (hsa-miR-494) |
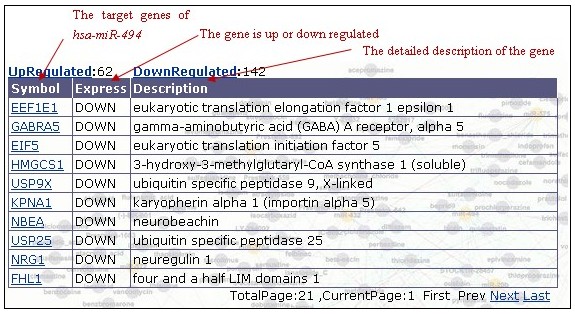
Step 3: Click "more" in the result page(Figure 2) to acquire the full list of the up-regulated and down-regulated target genes of the interested miRNA(Figure 3). Click "UpRegulted/DownRegulated" to return the up-regulated/down- regulated target gene of the interested miRNA (hsa-miR-494) and display in groups of ten. Click on the field name ("Symbol" and "Express") links to the new rank order page.
|
| Figure 3 The full list of differentially expressed target genes |
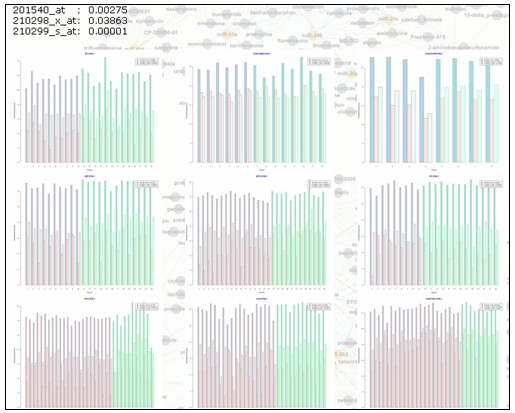
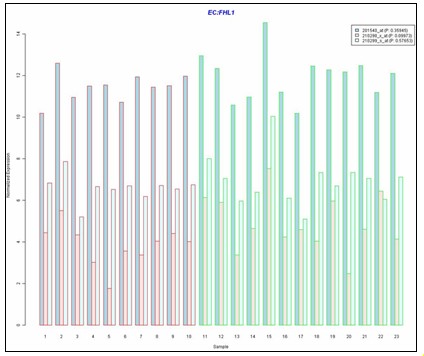
Step 4: Click each gene symbol link in Figure 3 to show the expression levels of the probes of the gene among all the samples in individual case-control Microarray study using bar charts. Click each bar chart to zoom in it. Figure 4 displays the expression levels of three probes which represent the PCMT1gene in nine case-control microarray studies. To focus on the first study, click it and show result in Figure 5.
|
| Figure 4 The multiple probes (three probes) expression levels corresponding to one gene (PCMT1 gene) |
|
| Figure 5 The multiple probes (three probes) expression levels corresponding to one gene (PCMT1 gene) in one case-control study (EC) |
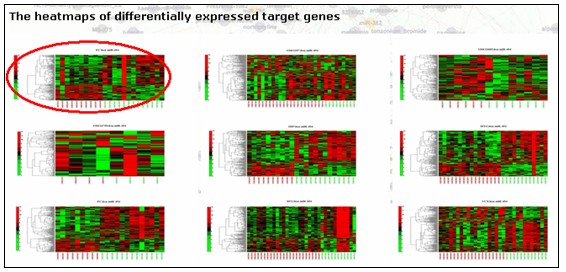
Step 5:At bottom of the full list of differentially expressed target gene (in Figure 2), we also illustrate the expression pattern of consistent differential expression target gene in each case-control microarray study referring to meta-analysis in the form of heat map (Figure 6). Click each heat map to zoom in it.
|
| Figure 6 Expression pattern of consistent differential expression target gene in each case control microarray study |
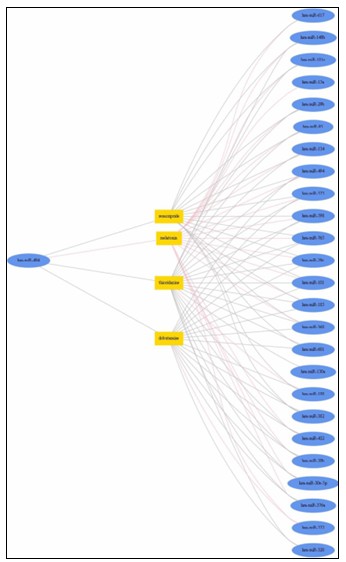
Step 6:Click "figure" in the result page (in Figure 2) to display the small molecule associated with hsa-miR-494, and other miRNAs directly connected with these small molecules (Figure 7). The pink edge denotes small molecule-miRNA association is negative, representing they may induce opposite transcriptional responses. The grey edge represents positive association.
|
| Figure 7 The cluster of the association of miRNA-small molecules-miRNAs |
Search by a small molecule:
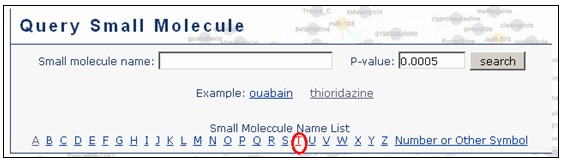
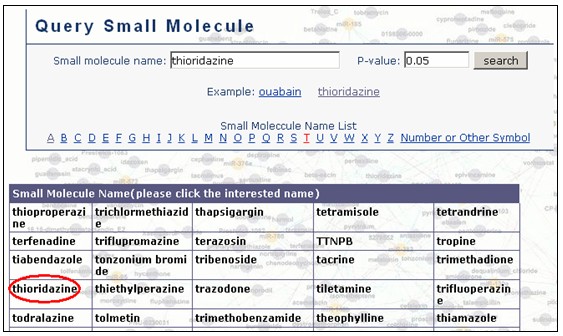
Step 1: Choose one of the interested small molecules from the "small molecule name list". You can enter an appropriate threshold of p-value ranging from 0 to 1 as the significance level. The default value is 0.05. For example, to find the associated miRNAs with thioridazine, we first click "T" in the list according to the initial letter (Figure 8). Then select "thioridazine" and click "search" button (Figure 9).
|
| Figure 8 Select small molecule (thioridazine) from the small molecule name list |
|
| Figure 9 Search for associations by a small molecule (thioridazine) |
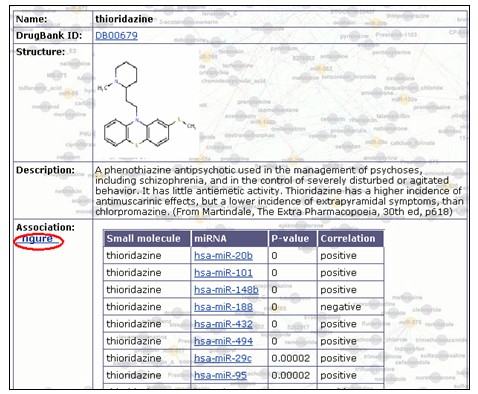
Step 2: The result page of the interested small molecule (Figure 10) contains the following 4 fields: Name - the queried small molecule name. DrugBank ID - Drugbank accession number which begins with 'DB' and is followed by five numbers (eg. DB00679). Structure - two-dimensional structure of the small molecule. Description - the brief information of the queried small molecule, including therapeutic category and indications. Association - miRNA list associated with the small molecule. The top-ranked set of miRNAs is displayed in groups of twenty. The rows in the table are ordered in ascending order of p-value in default. Click each field name ("miRNA" and "Correlation") to rank the entries in alphabetical order.
|
| Figure 10 The result page of the interested small molecule (thioridazine) |
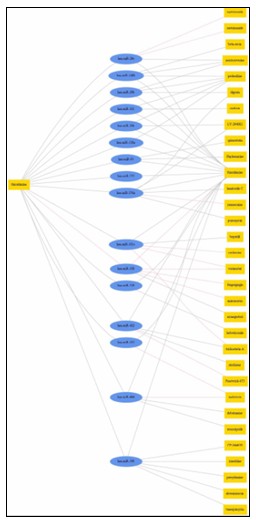
Step 3: Click "figure" in the result page (in Figure 10) to illustrate the miRNAs associated with thioridazine, and other small molecules directly linked with these miRNAs (Figure 11). Similarly, the pink edge denotes small molecule-miRNA association is negative, representing they may induce opposite transcriptional responses. The grey edge represents positive association.
|
| Figure 11 The cluster of the association of small molecule-miRNAs- small molecules |

|
Please don't hesitate to address comments / questions / suggestions regarding this website to: jiangwei@hrbmu.edu.cn |

|