Here, we performed expression profile similarity analysis to predict associations between small molecules and miRNAs. We built a response signature (i.e. the list of significantly differential expression probes) and a ranked response pattern (i.e. a full list of probes ranked
according the differential expression extent) for each small molecule, as well as for each miRNA. For a miRNA response signature (up and down) and small molecule ranked response pattern, we calculated a total enrichment score (TES), which was combined by two enrichment score for up and down
probe list of the miRNA response signature. As above, we assigned TES for pairwise small molecule response signature (up and down) and miRNA ranked response pattern. Finally, we integrated the TES scores for miRNAs and multiple small molecules, corresponding to the same type of small
molecule which was used to treat gene expression profile in different conditions, into association score (AS). Additionally, a permutation test was applied to measure the significance of AS.
The enrichment score (ES) of small molecule/miRNA-related response signature relative to miRNA/small molecule-related ranked response pattern
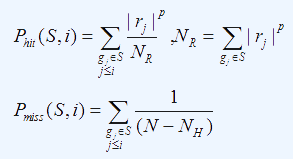
The Enrichment Score (ES) is the maximum deviation from zero of Phit - Pmiss.
Here,
S is the aforementioned response signature, which is the probes related to the phenotypic distinction (small molecule perturbation or miRNA perturbation), and represents the transcriptional responses to small molecule (or miRNA).
L is the ranked response pattern, which signifies the genome-wide transcriptional profile.
L comprises
N probe members. For the
ith member in
L,we evaluate the fraction of probes in
S (“hit”) weighted by their correlation and the fraction of probes
not in
S (“miss”) which are both present up to the given position
i in
L. We set parameter
p=1, weighting the probes in
S by their correlation with perturbation (small molecule or miRNA) normalized by the sum of the correlations over all of the probes in
S.
For both small molecule and miRNA, we divided the response signature into up-regulated probe sets and down-regulated probe sets to calculated
ES, respectively.The up-regulated or down-regulated probes of the miRNA-related response signature are searched within the ranked
response pattern of small molecule, resulting in two enrichment scores (ES
upmir2sm, ES
downmir2sm), respectively. Analogously, up-regulated and down-regulated probes of small molecule-related response signature are also searched within the ranked response
pattern of miRNA, producing two enrichment scores (ES
upsm2mir, ES
downsm2mir), respectively. We implemented the computational procedure of enrichment score with R program.
The similarity of small molecule-perturbed and miRNA-perturbed gene expression profiles (total enrichment score)
For a small molecule
i and miRNA
j, we firstly obtained ES
upsm2mir, ES
downsm2mir, ES
upmir2mir, ES
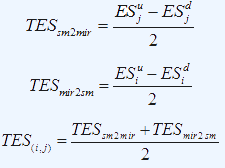
downmir2mir as above stated. As follows, we then combined ES
upsm2mir and ES
downsm2mir to Total Enrichment Score
(TES
sm2mir),and combined ES
upmir2sm, ES
downmir2sm to Total Enrichment Score (TES
mir2sm). Lastly, we used the mean of TES
sm2mir and TES
mir2sm to measure the TES
(i,j) of the pair of small molecule
i and miRNA
j.
Here,
ESxy (with x∈{
i,
j }, y∈{
us,
ds} for small molecule and y∈{
um,
dm} for miRNA) ranges in [-1,1].
ESxy is the enrichment score of the
y (up or down) response signature with respect to the ranked response pattern of
x.
It quantifies how much a set of genes (or probes) is at the top of a ranked full list. The closer this measure is to 1, the closer the genes are to the top of the ranked full list. The closer the value to -1, the closer the genes are to the bottom of the ranked full list.
TES
(i,j) also ranges in [-1,1]. It comprehensively quantifies how much the genes (or probes) in the up-regulated or down-regulated gene sets of (
u or
d) relative to small molecule
i are placed at the top or bottom of the miRNA
j and how much the genes (or probes) in the up-regulated or down-regulated gene sets (
u or
d)
relative to miRNA
j are placed at the top or bottom of the small molecule
i. The closer these two statements are to the truth, the farther to 0 is the value of TES
(i,j), that is to say the larger is the absolute value of TES
(i,j).
Pairwise association score (AS) of small molecules and miRNAs
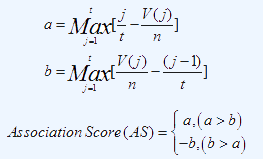
Since multiple gene expression profiles are relative to one small molecule (aforementioned ‘instances’), the final Association Score (AS) for a pair of small molecule and miRNA is a composite score by combining TES of several instances corresponding to the same small molecule with one miRNA via Kolmogorov-Smirnov (KS) test:
Here,
t is the number of instances corresponding to one small molecule.
n is the number of all the instances for all small molecules (
n=6100).
V(j) is the
jth element of the vector
V, and denotes the position of the
jth instance which are in the set of
t instances in the ordered list of all
n instances (
j=1,2,…,
t). All the
n instances are ranked in decreasing order according to the magnitude of TES.
Additionally, we performed a permutation test for each pair of small molecule and miRNA. We calculated 1000 random ASs generated by randomly sampling probes in ranked response pattern to form response signature while keeping the number of the response signature per small molecule or miRNA unchanged. The fraction of which the absolute value of the random AS is larger than that of the observed AS is defined as p-value.