Quick Start
Users should set up some parameters in order to start analysis with our web tool quickly (Figure 1). Details are in the following:
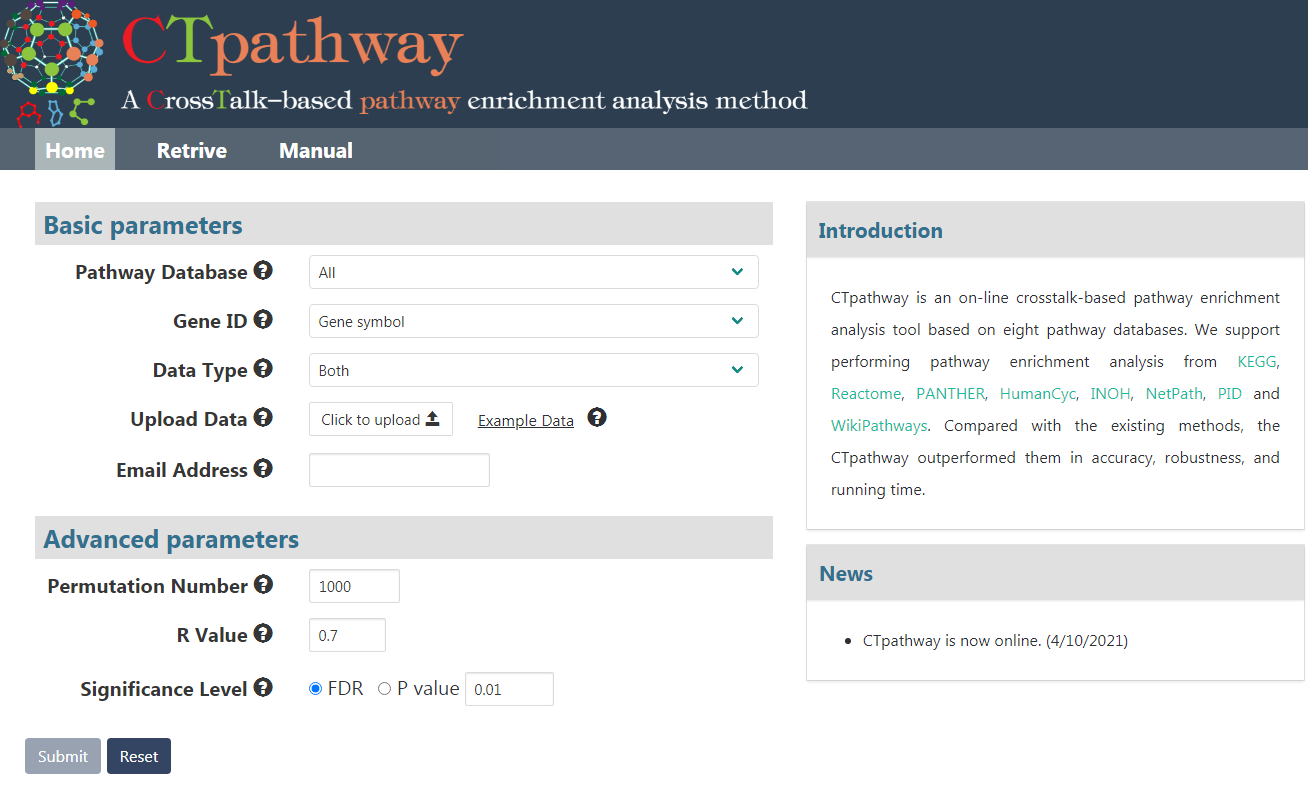
Figure 1. The screenshot of CTpathway home page.
Input
- Make sure that "Pathway Database" and "Gene ID" are selected.
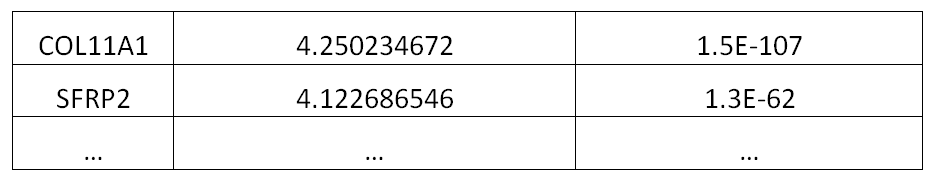
- Click the "Upload Data" button to upload gene differential expression data, which should include gene id, one or both of log2FC (Fold Change) value and P value. Notice: input file without head line is commanded. Here is an example of input data format including gene symbol, log2FC value and P value:
- Input your email address.
- Optionally selected advanced parameters including: Permutation number, R value (restart coefficient in RWR) and Significance Level.
- Click "Submit".
Retrive
After submitting a few minutes later, you will receive notification and retrieve the job results from the URL or job id in your inputted email and retrieve the results in the web server (Figure 2).
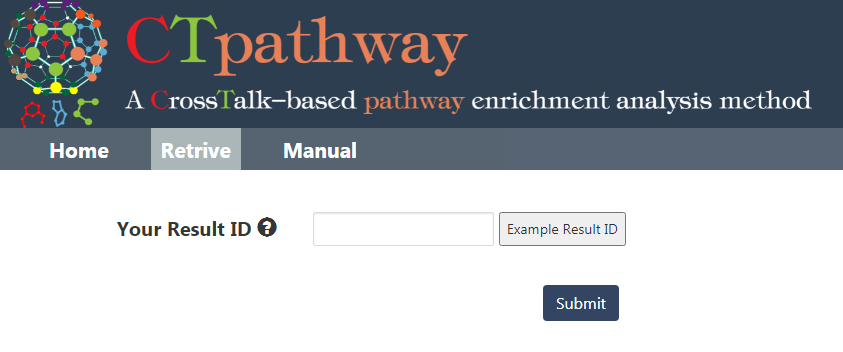
Figure 2. Retrive the results in the web server.
Output
The enrichment results of example input will be shown in the table Users can select "Significant" or "All" to show significant pathways or all candidate pathways and users can check detailed information about pathway by clicking on pathway name (Figure 3). The results visualization are also shown as Bar graph, Bubble plot and Enrichment map (Figure 4-6). Users can select parameter "Top XXX" to show different numbers of pathways by Bar graph and Bubble plot as well as parameter "Jaccard index XXX" to show different redundancies of pathways by Enrichment map pathways. In addition, the risk genes (top 100 genes ranked by RS) are shown (Figure 7). Users can also download all above results.
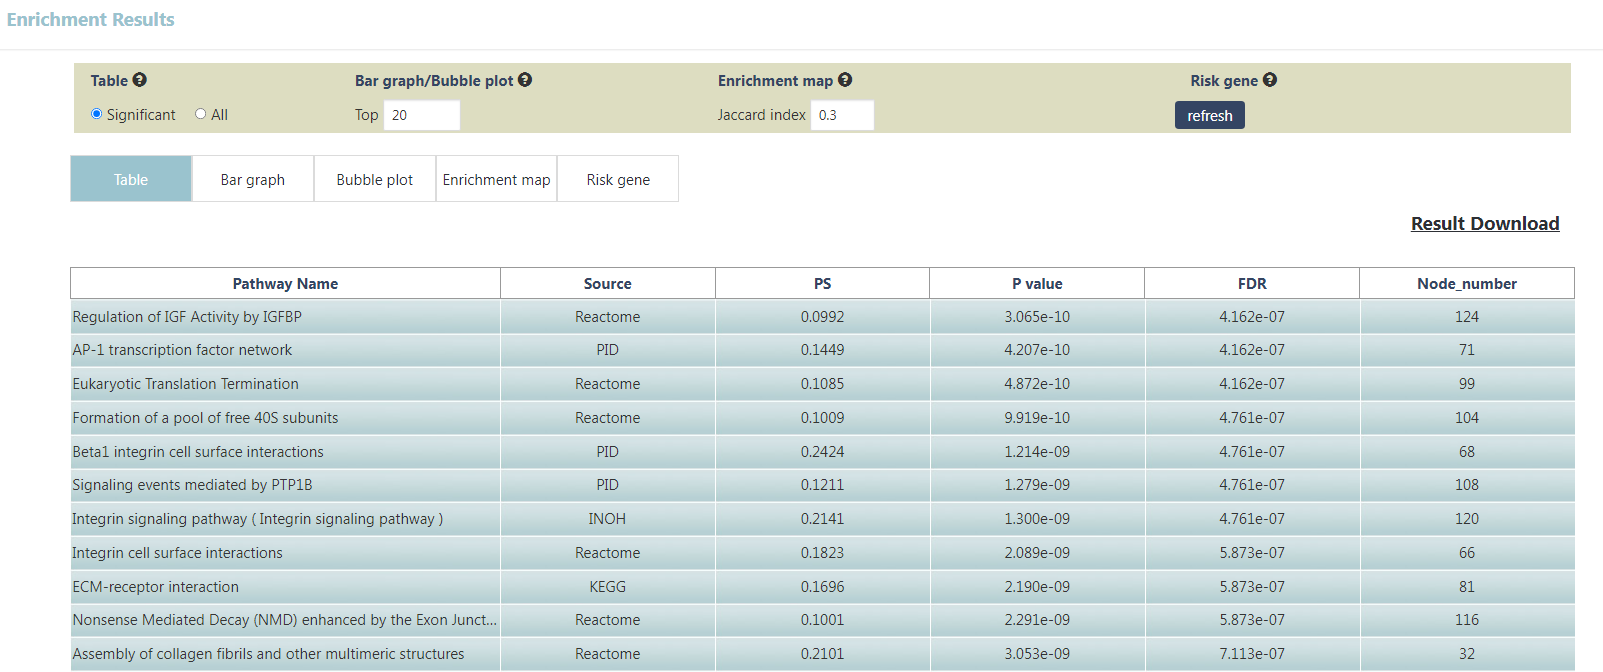
Figure 3. Significant pathways shown in table.
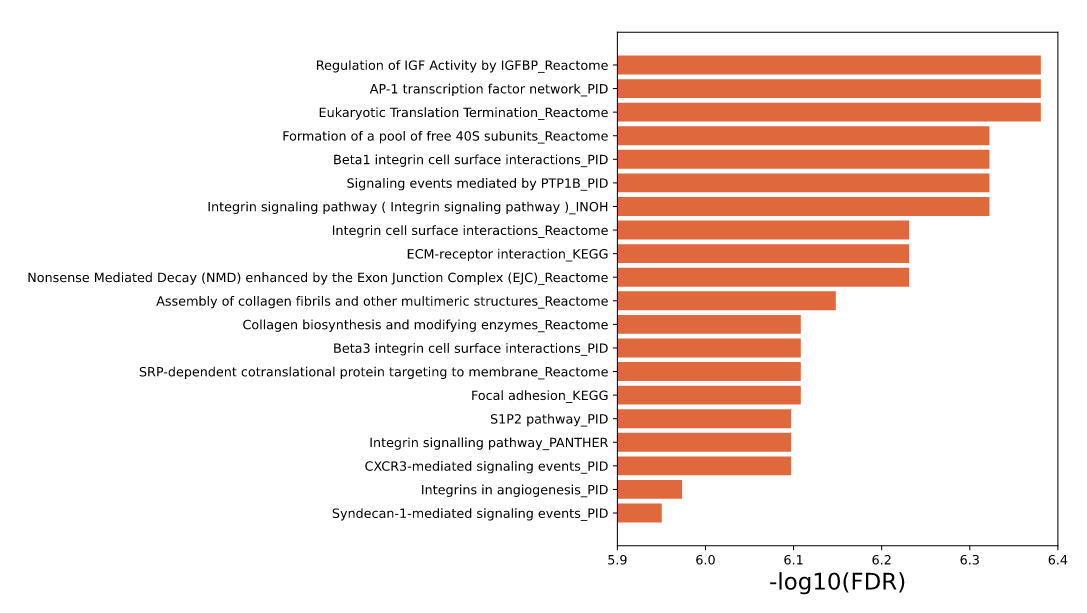
Figure 4. Top 20 results shown in Bar graph.
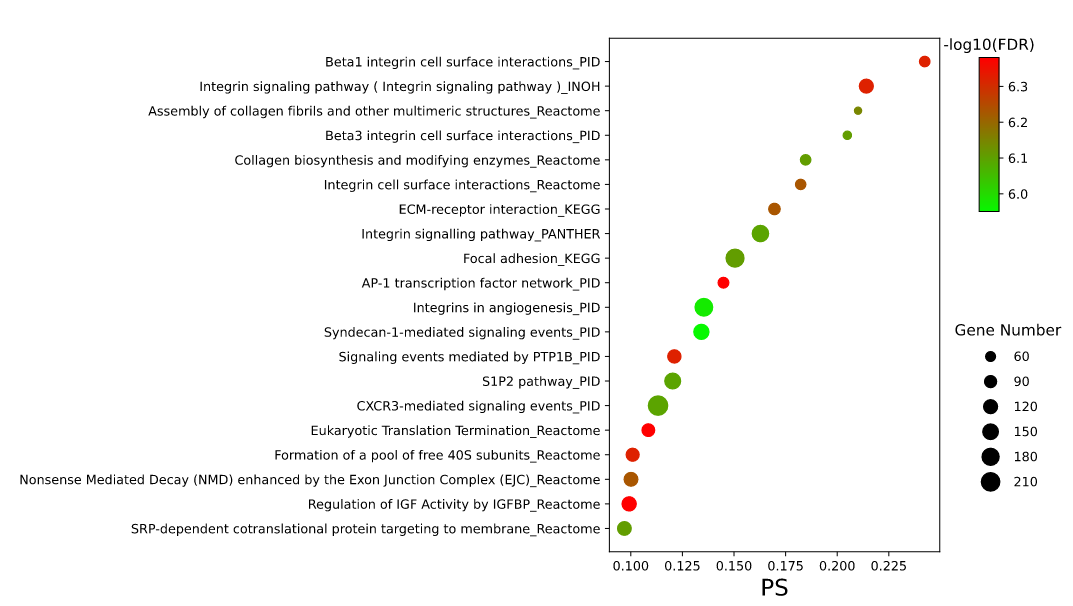
Figure 5. Top 20 results shown in Bubble plot.
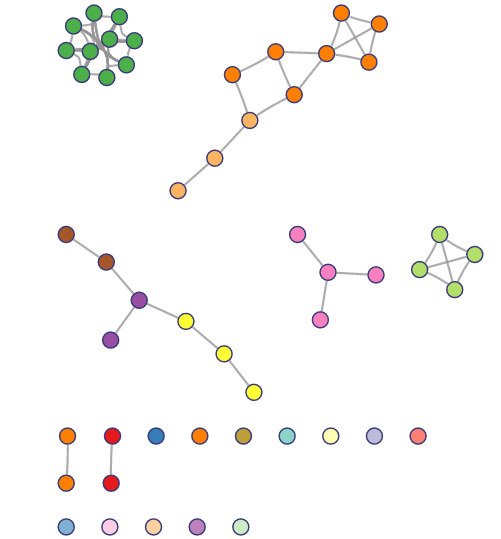
Figure 6. Top 20 clusters shown in Enrichment map.
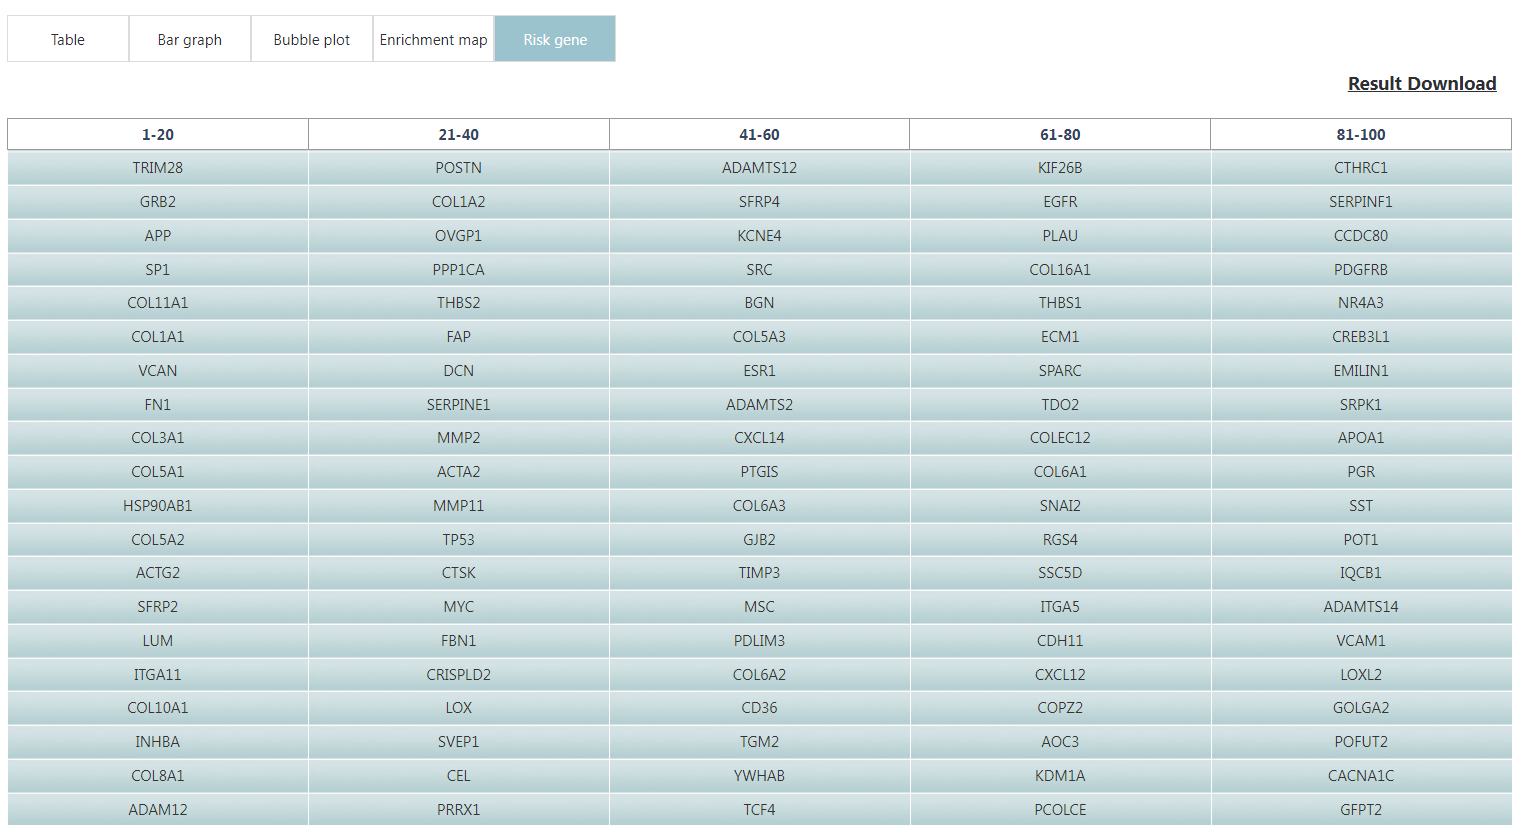
Figure 7. Risk genes are shown.